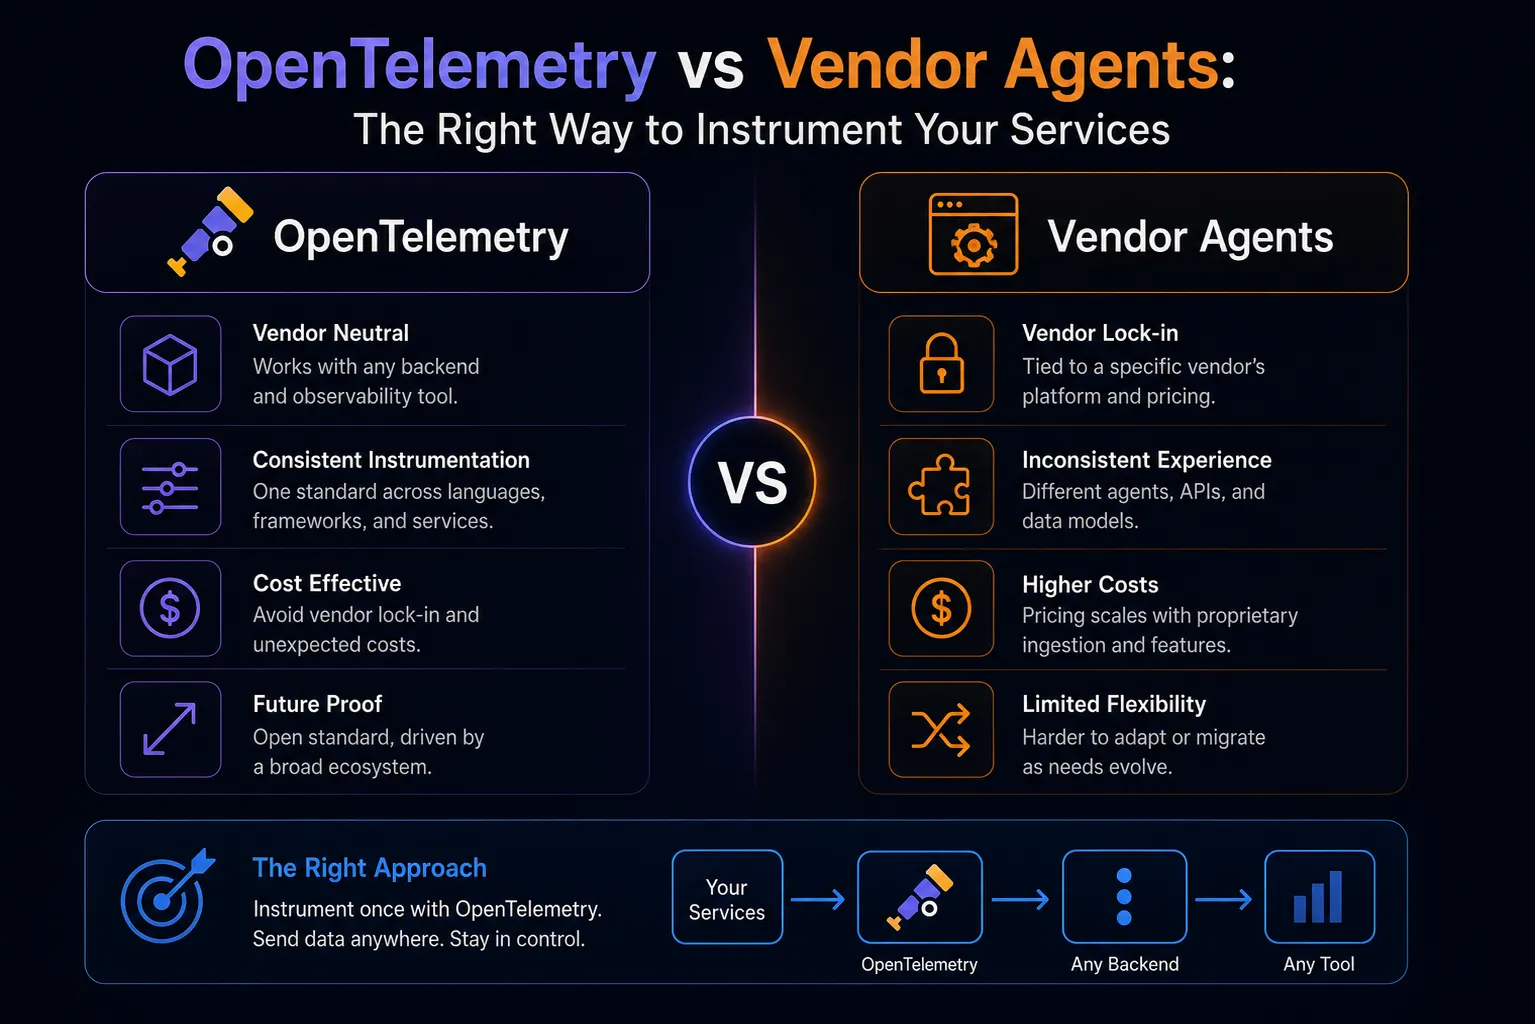
Most engineering teams instrument their services using vendor-provided agents: the Datadog agent, New Relic APM, Dynatrace OneAgent, or similar. OpenTelemetry offers a different approach—an open-source, vendor-neutral instrumentation standard that separates the what (collecting telemetry) from the where (sending it to a backend). The choice between them has become one of the more consequential observability decisions a platform team makes.
What OpenTelemetry Actually Is
OpenTelemetry (OTel) is a CNCF project that provides:
- Instrumentation libraries for 11+ languages (Go, Java, Python, Node.js, .NET, Ruby, etc.)
- A data model for traces, metrics, and logs (the three pillars of observability)
- The OpenTelemetry Collector (an agent/gateway that receives, processes, and exports telemetry to any backend)
- The OTLP protocol (the wire format for transmitting telemetry)
The key property: OpenTelemetry-instrumented code sends data to a Collector, and the Collector forwards it to any backend—Datadog, Grafana, Honeycomb, Jaeger, Prometheus, or multiple simultaneously. Switching backends doesn’t require re-instrumenting your code.
How Vendor Agents Work
Datadog agent, New Relic APM, and similar tools use a different model:
- Auto-instrumentation patches your runtime (Java agent loaded via -javaagent flag, Python bytecode manipulation, etc.) to capture traces and metrics without code changes
- Proprietary data format in the agent pipeline, converted to vendor format before transmission
- Deep integration with vendor-specific features (Datadog’s Live Tail, New Relic’s transaction traces, etc.)
The advantage is ease: install the agent, configure an API key, and telemetry flows. No code changes required for most frameworks.
The Lock-In Problem
Vendor agents create observability lock-in that’s more insidious than most infrastructure lock-in. When you switch Kubernetes providers, your application code doesn’t change. When you switch observability vendors, your instrumentation code might.
Custom instrumentation—spans you’ve added to track specific business operations, attributes you’ve annotated for filtering, events you’ve recorded for debugging—is often vendor-specific if you’ve used the vendor’s SDK directly. Custom Datadog traces that use ddtrace SDK calls don’t export to Grafana. Custom New Relic traces don’t export to Honeycomb.
When observability vendors raise prices (and they do), the switching cost includes re-instrumenting all your custom code. Teams have paid multiples more than they should for observability because the migration cost was too high.
Auto-Instrumentation: OTel vs. Vendor Agents
This is where vendor agents have a genuine advantage today.
Vendor auto-instrumentation is mature and covers deep framework integration. The Datadog Java agent instruments Spring, Hibernate, JDBC, gRPC, and hundreds of other libraries with zero code changes and provides rich traces out of the box.
OTel auto-instrumentation has improved substantially but still lags for some frameworks. The Java agent covers the major frameworks; the Python and Node.js agents are production-grade for common stacks. For exotic frameworks or languages, OTel auto-instrumentation may capture less than a vendor agent.
The gap has narrowed significantly in 2024–2025. For mainstream stacks (Java/Spring, Node.js/Express, Python/Django or FastAPI, Go standard library), OTel auto-instrumentation provides comparable coverage to vendor agents.
The Collector: OTel’s Architectural Advantage
The OpenTelemetry Collector is what makes the OTel model genuinely powerful. The Collector is a standalone process (deployed as a sidecar, DaemonSet, or standalone service) that receives OTLP data, processes it (filter, transform, sample, enrich), and exports to one or more backends.
This enables patterns that vendor agents don’t support:
Multi-backend export: Send traces to Grafana Tempo and Datadog simultaneously. Run cost comparison experiments. Migrate incrementally by routing new service traffic to the new backend while old services stay on the old one.
Tail-based sampling at the Collector: Make sampling decisions after seeing the full trace (keep all error traces, sample 1% of successful traces) rather than making per-span sampling decisions at the SDK level.
PII redaction in the pipeline: Strip sensitive attributes (email addresses, credit card fragments) in the Collector before data leaves your infrastructure, rather than hoping the vendor doesn’t store it.
Cost control: Filter high-cardinality, low-value metrics or traces in the Collector before they hit a paid backend. Teams report 40–60% cost reductions by implementing sampling and filtering in the Collector pipeline.
Adoption Strategy: Not All-or-Nothing
The most pragmatic approach for most teams is incremental adoption:
Start new services with OTel instrumentation. Use OTel SDKs for new services, export to your existing vendor backend via its OTLP endpoint (most major vendors accept OTLP now—Datadog, Grafana, Honeycomb, New Relic, Dynatrace all do).
Keep vendor auto-instrumentation for existing services where re-instrumentation isn’t justified. Vendor agents and OTel agents can coexist in most environments.
Deploy the OTel Collector as the central telemetry gateway. Route both vendor agent data (via the Datadog receiver or other vendor receivers in the Collector) and OTel data through the Collector. This gives you the processing pipeline benefits immediately.
Migrate custom instrumentation as you touch services for other reasons. Replace vendor SDK calls with OTel API calls.
This approach captures most of OTel’s long-term benefits without requiring a big-bang migration.
When Vendor Agents Are Still the Right Call
You’re on a single vendor and have no plans to change. If Datadog is deeply embedded in your workflows and you’re not price-sensitive, the migration cost may not be worth the portability benefit.
Your stack is exotic. If you’re running Erlang, COBOL, or MATLAB—vendor agent support is probably better than OTel’s coverage.
You need vendor-specific features. Datadog’s APM has features (profiling, Live Tail, security signals correlated with traces) that aren’t replicated in OTel. If those features are load-bearing for your workflows, keeping the vendor agent is rational.
When OTel Is the Right Call
You’re evaluating observability vendors. Starting with OTel means you can run multiple vendors in parallel and switch based on actual evaluation results rather than switching cost.
You’re cost-sensitive. OTel + a cheaper backend (Grafana Cloud, Signoz, Jaeger self-hosted) is often dramatically less expensive than Datadog or New Relic for high-volume teams.
You’re building a platform engineering practice. Standardizing on OTel across teams means the platform can route telemetry to different backends per team, implement organization-wide sampling policies centrally, and evolve the observability stack without re-instrumenting everything.
You’ve been burned by vendor pricing. If you’ve received a surprise renewal quote and want optionality, OTel is the architecture that provides it.
The Verdict
OpenTelemetry has crossed the maturity threshold for production use in mainstream stacks. For new services, OTel instrumentation with OTLP export to any backend is the right default. For existing services, the incremental adoption path—OTel Collector as a processing gateway, migrate custom instrumentation over time—captures most of the benefit without the disruption of a full re-instrumentation.
Vendor agents remain easier for zero-effort auto-instrumentation on day one. The question is whether you want “easy today” or “flexible tomorrow.”