Every AWS account comes with CloudWatch already running. Metrics from EC2, RDS, Lambda, ALB, and 70+ other services flow into it automatically. Prometheus, on the other hand, requires deliberate effort: you deploy it, configure scrape targets, manage storage, and build dashboards yourself. One is the default. The other is a choice.
That choice matters more than most teams realize until they’ve outgrown the default. Here’s what each does well, where each falls short, and how to decide.
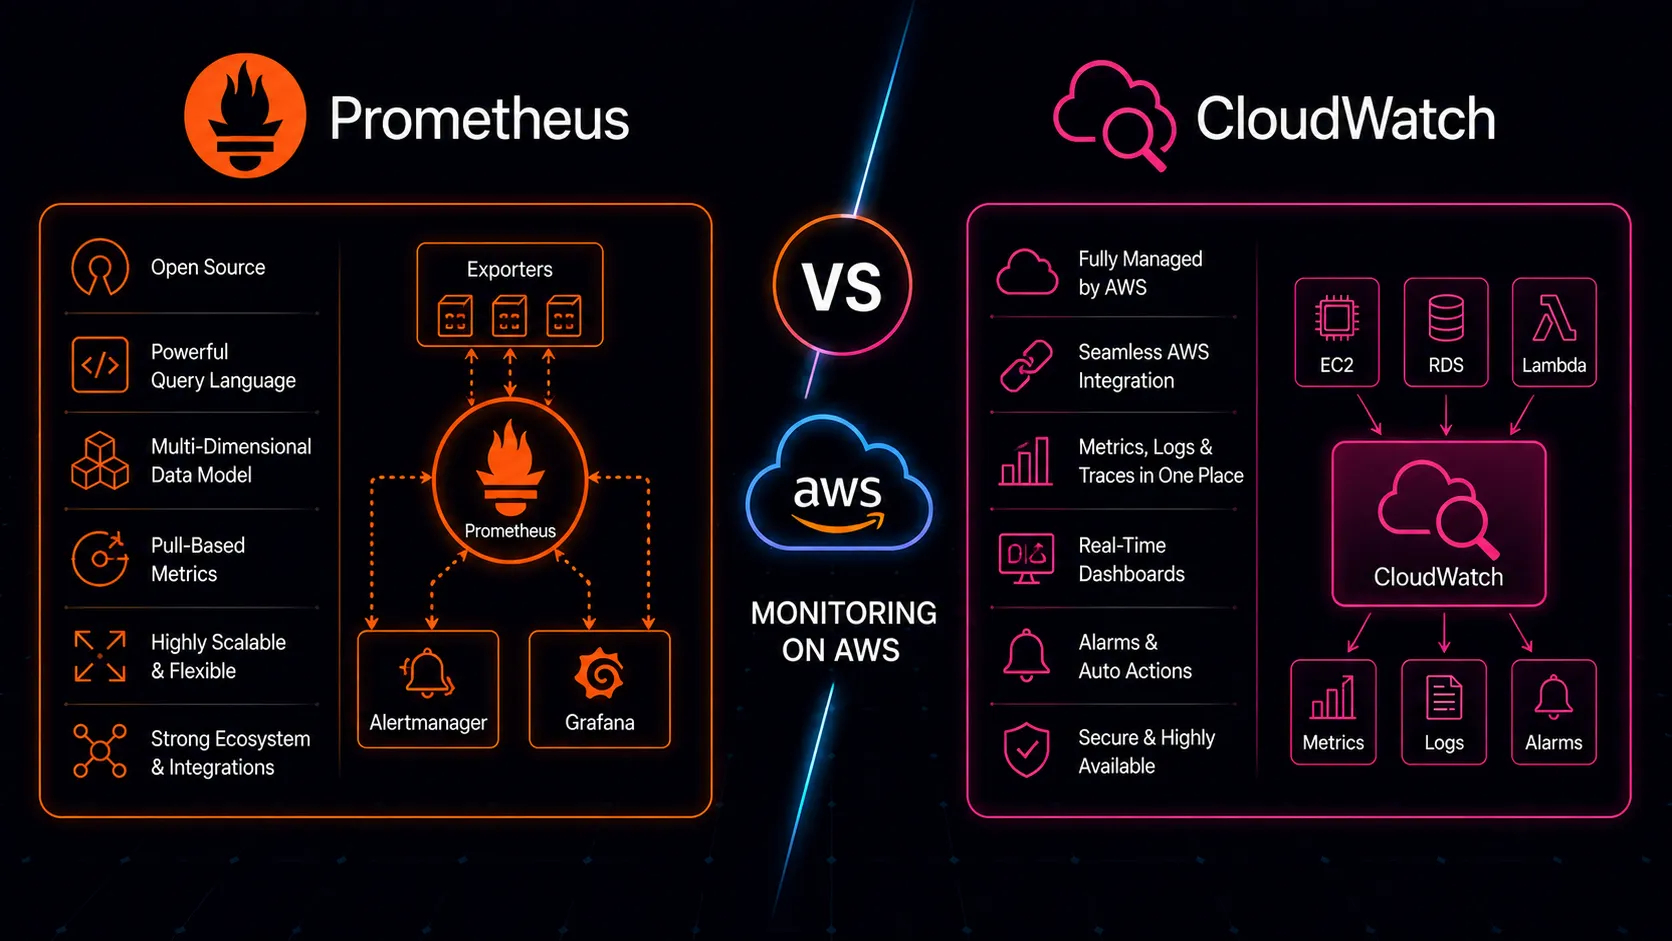
The Default: What CloudWatch Gives You
CloudWatch’s greatest strength is that it exists without anyone setting it up. Launch an EC2 instance and CPU utilization, network traffic, and disk I/O metrics appear. Create an RDS database and you get read/write latency, connection counts, and replication lag. Deploy a Lambda function and invocation counts, duration, and error rates are tracked automatically. Enable an ALB and you get request counts, target response times, and HTTP status code breakdowns.
This zero-setup coverage is genuinely valuable. For basic infrastructure health monitoring, CloudWatch delivers useful signals from day one. The metrics are consistent, they’re retained for 15 months (at decreasing resolution–1-minute data for 15 days, 5-minute for 63 days, 1-hour for 455 days), and they require no agent installation or configuration for standard AWS service metrics.
Beyond metrics, CloudWatch provides an integrated ecosystem. CloudWatch Logs collects log data with Logs Insights for SQL-like querying across log groups. CloudWatch Alarms triggers notifications and auto-scaling actions based on metric thresholds. Container Insights gives visibility into ECS and EKS clusters. ServiceLens ties metrics, logs, and traces together for distributed applications. These services share IAM permissions, work within VPCs without extra networking, and bill through the same AWS account.
For teams running standard AWS infrastructure without heavy customization, this integrated experience is hard to beat. Everything is in one place, managed by AWS, and accessible through the same console and APIs. There’s no monitoring infrastructure to provision, patch, or scale.
The Choice: What Prometheus Brings
Prometheus was built by engineers at SoundCloud who needed monitoring that matched how modern distributed systems actually behave. It was designed around a pull-based model, a powerful dimensional data model, and a query language that treats time-series data as a first-class concept. It later became the second project to graduate from the Cloud Native Computing Foundation, after Kubernetes itself–a reflection of how central it is to modern infrastructure.
Pull-Based Model
Prometheus scrapes metrics from targets on a schedule, rather than having targets push metrics to a central service. This inversion matters. The monitoring system knows what it should be scraping and can detect when a target disappears–silence itself becomes a signal. In CloudWatch’s push model, a service that stops emitting metrics looks the same as a service that’s healthy but idle. With Prometheus, a failed scrape is an immediate, detectable event.
The pull model also simplifies service development. Your application exposes an HTTP endpoint with current metric values. It doesn’t need to know where Prometheus is, how to authenticate to a metrics backend, or what to do when the monitoring system is temporarily unavailable. The application’s only job is to maintain its counters and gauges; Prometheus handles collection.
Application Instrumentation
Where CloudWatch monitors AWS services, Prometheus monitors applications. Its client libraries for Go, Java, Python, Node.js, and other languages let you instrument your code directly. Expose a /metrics endpoint, configure Prometheus to scrape it, and you have application-level observability that CloudWatch’s custom metrics API can’t match for convenience or granularity.
The ecosystem extends far beyond application code. Exporters exist for nearly everything: databases, message brokers, hardware, network devices, third-party services. The node_exporter alone provides hundreds of system-level metrics that go well beyond what the CloudWatch agent collects. The mysqld_exporter, redis_exporter, and blackbox_exporter each fill specific gaps that would require custom CloudWatch integrations to replicate.
Dimensional Data Model
Prometheus metrics carry labels–arbitrary key-value pairs that let you slice and aggregate data flexibly. A single metric like http_requests_total can carry labels for method, endpoint, status code, and service version. You don’t decide upfront which dimensions to track; you query across any combination of labels at read time.
CloudWatch dimensions serve a similar purpose but are more rigid. Dimensions are fixed at write time, and each unique combination of dimensions creates a separate metric stream (with separate costs). Prometheus’s label-based model is fundamentally more flexible and doesn’t penalize high cardinality at the data model level.
Portability
Prometheus is cloud-agnostic by nature. Your monitoring configuration, alerting rules, dashboards, and queries work the same whether you’re running on AWS, GCP, Azure, or bare metal. For organizations with multi-cloud or hybrid strategies, this portability has real strategic value. If you move a workload from EC2 to on-premises servers, your Prometheus monitoring follows without modification. Your CloudWatch dashboards don’t.
Query Power: Where the Gap Is Widest
This is where the comparison gets lopsided. PromQL is arguably the most significant reason teams adopt Prometheus.
CloudWatch Metrics Insights lets you query metrics with SQL-like syntax. You can filter, group, and aggregate. For basic questions–what’s the average CPU across these instances, which Lambda functions have the highest error rate–it works. But the language hits walls quickly when you need to express relationships between metrics or perform calculations across time series.
PromQL operates on a fundamentally different level. Want the 95th percentile of request latency over the last hour? histogram_quantile(0.95, rate(http_request_duration_seconds_bucket[1h])). Want to find services where error rate exceeds 1% of total requests? rate(http_requests_total{status=~"5.."}[5m]) / rate(http_requests_total[5m]) > 0.01. Want to predict when a disk will be full based on current growth trends? predict_linear(node_filesystem_avail_bytes[6h], 24*3600).
These aren’t contrived examples. They represent the kinds of questions you ask during incidents and capacity planning. PromQL handles ratios, rates of change, histogram aggregation, label-based joins, and prediction natively. CloudWatch Metrics Insights doesn’t support most of these operations, and the workarounds–if they exist–involve stitching together multiple API calls in application code.
Pair PromQL with Grafana and you get visualization that CloudWatch dashboards can’t match. Variable-driven dashboards let you switch between services, environments, or instances with dropdown selectors. Ad-hoc exploration lets you compose queries live and see results instantly. Template queries that work across all your services mean you build a dashboard once and it adapts to any service you point it at. Grafana was built for Prometheus and it shows–the integration is seamless in a way that CloudWatch dashboards, constrained to their own ecosystem, aren’t.
Cost: Different Models, Different Pain Points
CloudWatch pricing is straightforward for basic usage and surprisingly expensive for advanced usage. Standard metrics from AWS services are free. But custom metrics cost $0.30 per metric per month. High-resolution metrics (1-second granularity) cost more. Dashboard widgets, API calls, Logs Insights queries, and log ingestion all add up. Teams that instrument their applications heavily through CloudWatch custom metrics often face bills that grow faster than expected.
The bill becomes particularly painful with high-cardinality data. If you want per-endpoint, per-status-code, per-customer-tier metrics in CloudWatch, the number of custom metric streams multiplies quickly, and so does the cost.
Prometheus has a different cost model entirely. You pay for the infrastructure to run it: compute, storage, and network. Whether you scrape 1,000 metrics or 1,000,000 metrics, the infrastructure cost is largely fixed (assuming you’ve sized it appropriately). Adding a new metric dimension doesn’t increase your monitoring bill. This fixed-cost model encourages rich instrumentation rather than penalizing it.
To put concrete numbers on it: a team running 20 microservices with 50 custom metrics each, across 3 dimensions with 10 values per dimension, would have 30,000 CloudWatch custom metric streams costing roughly $9,000 per month. That same cardinality in Prometheus runs comfortably on a single instance that costs a fraction of that. The math shifts at scale, but the direction is consistent–CloudWatch penalizes cardinality, Prometheus doesn’t.
The trade-off is operational. Someone has to run the Prometheus infrastructure, manage storage retention, handle upgrades, and ensure high availability. That operational cost is real, even if it doesn’t show up on a cloud bill. For a small team without dedicated infrastructure expertise, this hidden cost can exceed the CloudWatch bill it replaces.
Application Metrics: Instrumentation Friction
Prometheus client libraries make application instrumentation natural. In a Go service, you define a histogram, register it, and increment it where relevant. The metrics endpoint is exposed automatically, and Prometheus scrapes it on schedule. Adding a new metric is a few lines of code.
CloudWatch custom metrics work differently. You call the PutMetricData API, which means constructing metric objects, handling batching (CloudWatch limits calls to 1,000 data points), managing API throttling, and deciding on dimensions upfront. The CloudWatch embedded metric format reduces some friction by letting you emit metrics through structured log lines, but it’s still more ceremony than a Prometheus counter increment.
This difference in friction matters more than it seems. When adding a metric is easy, developers instrument more. They add a histogram for database query duration because it takes two lines. They add a counter for cache hits because it’s trivial. They add labels for customer tier because it costs nothing. When instrumentation requires API calls, batching logic, and cost awareness, developers instrument less–and the team ends up with blind spots during incidents.
The result is that Prometheus-instrumented applications tend to have significantly richer observability than CloudWatch-instrumented ones. Not because Prometheus is inherently better at collecting data, but because the low friction changes developer behavior.
AWS Managed Prometheus: The Middle Ground
Amazon Managed Service for Prometheus (AMP) tries to give you both worlds. It’s a managed, Prometheus-compatible service that handles storage, scaling, and availability. You configure your applications to remote-write metrics to AMP and query them with PromQL through the AMP endpoint or through Amazon Managed Grafana.
AMP eliminates the biggest operational burden of self-managed Prometheus: running and scaling the storage backend. You keep PromQL, you keep your existing Prometheus instrumentation and exporters, and you don’t have to manage Prometheus servers or worry about disk space for metric retention. For EKS-heavy organizations in particular, AMP integrates well with the AWS Distro for OpenTelemetry (ADOT) collector, providing a clean path from application instrumentation to managed storage.
Paired with Amazon Managed Grafana (AMG), you get the Prometheus-plus-Grafana stack without operating any of it yourself. AMG handles Grafana deployment, authentication through AWS SSO, and data source configuration. The combination of AMP and AMG is essentially “the Prometheus stack as a service.”
The trade-offs are cost and coupling. AMP charges per metric sample ingested and per query processed. At high metric volumes–say, a large EKS cluster with hundreds of pods, each exposing detailed application metrics scraped every 15 seconds–these ingestion costs add up. Run the numbers against what self-managed Prometheus on a couple of EC2 instances would cost. At moderate scale, AMP is often cheaper when you factor in operational time. At very high scale, the per-sample pricing can exceed self-managed costs.
There’s also the coupling question. While AMP is Prometheus-compatible, it’s an AWS service. You’re back to cloud-specific infrastructure for your monitoring platform, which reduces the portability advantage that drew you to Prometheus in the first place. Whether that matters depends on how seriously you take multi-cloud as a strategy versus a theoretical concern.
Alerting: Alarms vs Alertmanager
CloudWatch Alarms are simple and effective for basic cases. Set a threshold on a metric, choose an action (SNS notification, Auto Scaling trigger, EC2 action), and the alarm fires when the threshold is breached. Composite alarms let you combine multiple alarm states with AND/OR logic–alert only when both error rate is high and latency is elevated, for example. For infrastructure-level alerts–CPU too high, disk space low, Lambda errors increasing–CloudWatch Alarms are perfectly adequate and require no additional infrastructure. They integrate with SNS, which can fan out to email, SMS, Slack through Lambda, or PagerDuty.
Prometheus Alertmanager is more capable but more complex. Alerting rules are written in PromQL, which means your alerts can use the same powerful expressions as your queries. Alert on the ratio of errors to total requests, on the rate of change of queue depth, on predicted resource exhaustion. Alertmanager then handles routing, grouping, silencing, and inhibition.
Grouping means that 50 related alerts arrive as one notification instead of 50. Inhibition means that if the database is down, you suppress the downstream alerts from services that depend on it. Silencing lets you mute known issues during maintenance. These features reduce alert fatigue in ways CloudWatch Alarms don’t natively support.
The cost of this capability is configuration complexity. Alertmanager routing rules are powerful but not intuitive. The routing tree, with its match and match_re conditions, group_by settings, and timing parameters (group_wait, group_interval, repeat_interval), takes real effort to get right. Most teams go through several iterations before their alerting behaves the way they want. CloudWatch Alarms are simpler to set up–you can create useful alarms through the console in minutes–even if they’re less sophisticated in how they handle alert lifecycle.
When CloudWatch Is Enough
CloudWatch handles the monitoring needs of many AWS teams without any supplement. It’s important to be honest about this, because the Prometheus community can make it sound like everyone needs a dedicated time-series database. You probably don’t need Prometheus if:
- Your monitoring needs center on AWS service metrics: EC2, RDS, Lambda, ECS health and performance. These are exactly the metrics CloudWatch was built to collect, and it does so with zero effort on your part.
- Your alerting is threshold-based: notify when values exceed static limits. CloudWatch Alarms handle this well, and composite alarms handle basic multi-condition logic.
- Your team is small and doesn’t have capacity to operate additional infrastructure. Running Prometheus reliably–with proper retention, backup, and high availability–takes time that a five-person team may not have.
- Your dashboards are straightforward: a few key metrics per service, viewed during incidents or weekly reviews.
- You’re running a single AWS account without multi-cloud considerations.
- Your application metrics are minimal or handled through CloudWatch custom metrics at a cost you find acceptable.
In these cases, adding Prometheus introduces complexity without proportional benefit. CloudWatch’s integrated, zero-operations model is a genuine advantage when it covers your needs.
Don’t add infrastructure to your monitoring stack just because someone wrote a blog post about how powerful PromQL is. The best monitoring system is the one your team actually uses and maintains, not the one with the most impressive query language.
When to Add Prometheus
Certain needs reliably push teams beyond what CloudWatch can reasonably provide:
Application-level instrumentation at scale. When you need dozens of custom metrics per service with high-cardinality dimensions, CloudWatch custom metrics become expensive and cumbersome. Prometheus client libraries make rich instrumentation practical and cost-effective.
Complex queries and analysis. When you need to calculate ratios, rates of change, percentiles from histograms, or predictions, PromQL is the right tool. If you find yourself writing Lambda functions to compute derived metrics because CloudWatch can’t express what you need, that’s a clear signal you’ve outgrown it.
Kubernetes workloads. Prometheus is the de facto monitoring standard for Kubernetes. The ecosystem–kube-state-metrics, node_exporter, cAdvisor, operator-based deployment–is mature and well-integrated. CloudWatch Container Insights provides some Kubernetes visibility, but it doesn’t match the depth of native Prometheus monitoring for pod-level metrics, container resource usage, and cluster internals. If you’re running EKS, you’ll likely end up with Prometheus whether you planned for it or not.
Multi-cloud or hybrid environments. If you run workloads across AWS and another cloud or on-premises, Prometheus gives you consistent monitoring across all environments. CloudWatch only sees AWS. A single Grafana instance querying Prometheus servers in multiple environments gives you unified visibility that no single cloud’s native monitoring can provide.
Grafana-driven visualization. If your team lives in Grafana for dashboards and exploration, Prometheus is the natural data source. CloudWatch can be a Grafana data source too, but the query experience is better with Prometheus, and Grafana’s community dashboards overwhelmingly target Prometheus.
Cost control at high metric volumes. When custom metric costs in CloudWatch start exceeding what you’d pay to run Prometheus infrastructure, the economics shift. This tipping point comes sooner than most teams expect, especially when multiple services each expose metrics with several dimensions.
The transition doesn’t have to be all-or-nothing. Many teams run Prometheus alongside CloudWatch for months or years, and that’s fine. CloudWatch continues to collect AWS service metrics automatically while Prometheus handles application-level instrumentation. The two systems serve complementary purposes, and trying to consolidate onto one or the other often creates more problems than it solves.
The Bottom Line
Most AWS teams should start with CloudWatch. It’s already there, it covers AWS service metrics comprehensively, and it requires no additional infrastructure. Fighting the default when it works well enough is wasted effort.
But “start with” doesn’t mean “stay with forever.” As applications grow more complex, as teams need richer instrumentation, and as monitoring requirements evolve beyond simple thresholds and basic dashboards, CloudWatch’s limitations become real constraints.
PromQL alone justifies adding Prometheus for many teams. The ability to ask sophisticated questions about your systems during a 3 AM incident–questions that CloudWatch simply can’t express–is worth the operational investment. And with AMP reducing the operational burden, the barrier to adopting Prometheus on AWS is lower than it’s ever been.
The practical path for most organizations looks like this: use CloudWatch for AWS infrastructure metrics where it’s free and automatic. Add Prometheus when you need application-level observability with depth and flexibility. Use Grafana to bring both data sources into a single pane of glass. Consider AMP if you want the Prometheus experience without the operational burden, but model the costs against your actual metric volume first.
You don’t have to choose one or the other. In fact, framing it as a binary choice misses the point. CloudWatch and Prometheus are complementary more often than they’re competitive. The teams with the best observability use each where it’s strongest and accept that monitoring, like most infrastructure decisions, isn’t one tool but a considered combination of tools that each do what they’re good at.