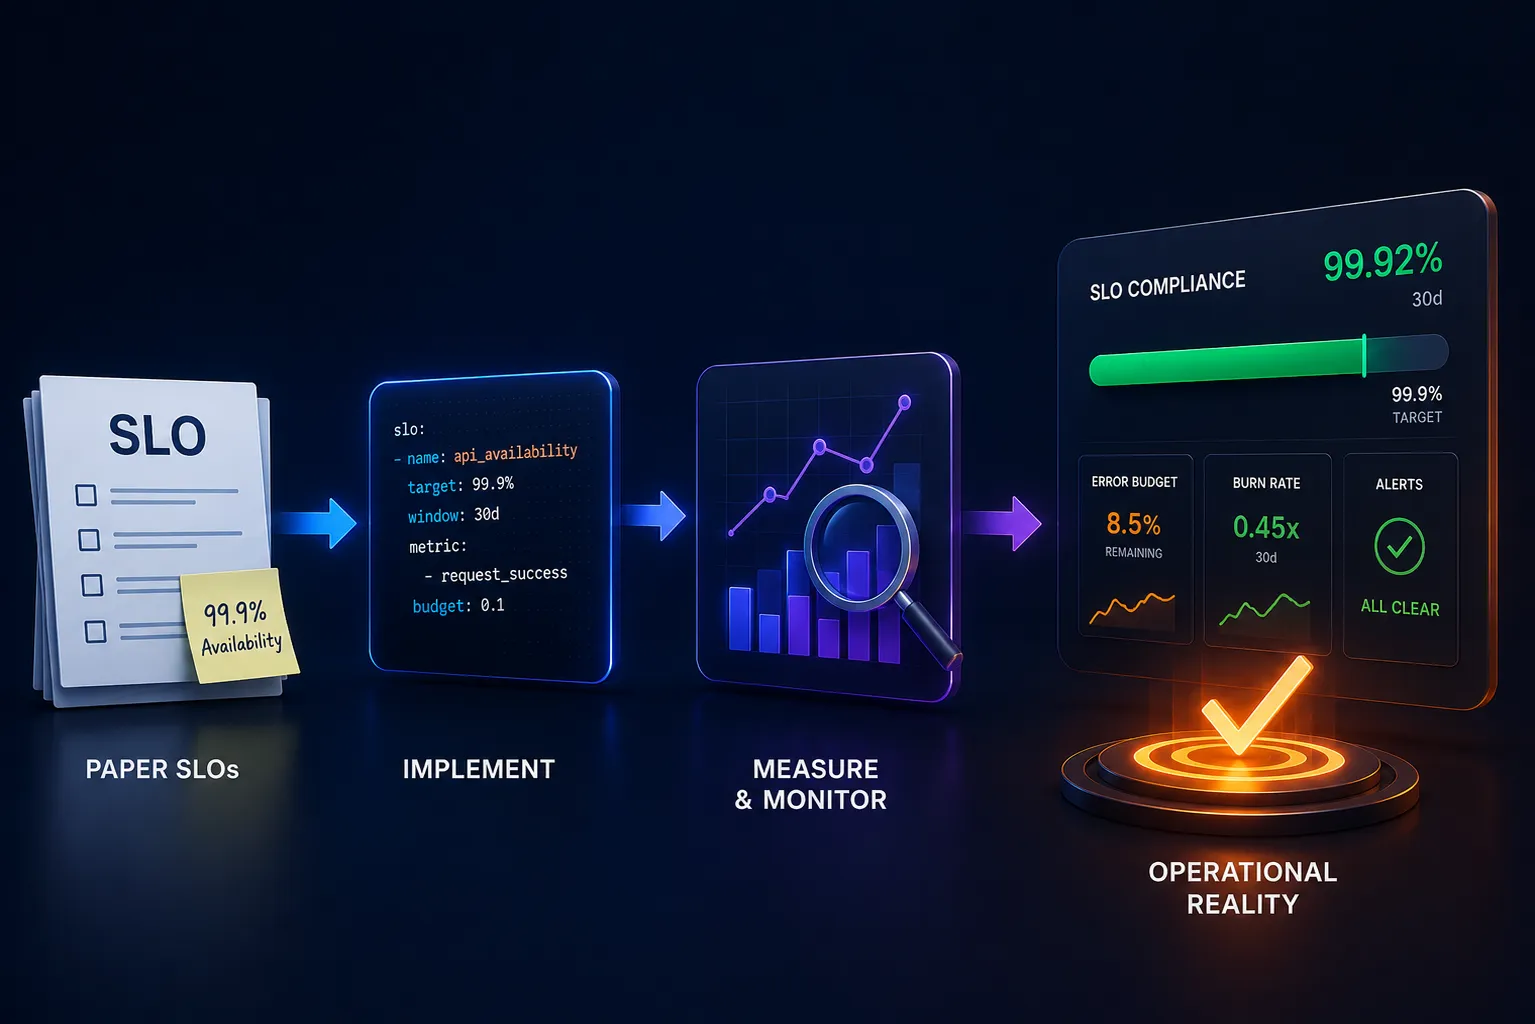
Service Level Objectives (SLOs) are one of the most valuable tools in reliability engineering—and one of the most commonly implemented incorrectly. The failure mode is predictable: a team defines SLOs in a document, sets up a dashboard, and then ignores the dashboard because the SLOs don’t drive any actual decisions. SLOs are closely related to DORA metrics—both are diagnostic tools that improve software delivery when enforced, not just measured.
This guide covers the mechanics of implementation, the common mistakes that make SLOs toothless, and what a working SLO program actually looks like in practice.
SLI, SLO, SLA: The Relationship
Service Level Indicator (SLI): A quantitative measure of service behavior. Examples: the proportion of HTTP requests that complete with a 2xx status within 200ms; the proportion of API calls that return a correct result; the percentage of time a database is available.
Service Level Objective (SLO): A target for an SLI. “99.9% of requests will complete successfully within 200ms over a 30-day rolling window.”
Service Level Agreement (SLA): An external commitment, usually contractual, with consequences for violation (credits, refunds). SLAs are a business/legal instrument. SLOs are an engineering instrument.
The SLO should be stricter than the SLA. If your SLA commits to 99.9% availability, your SLO might target 99.95%—leaving a buffer so the team has warning before the SLA is breached.
Defining Meaningful SLIs
The most common SLO mistake is measuring what’s easy to measure rather than what matters to users.
Avoid: Internal infrastructure metrics (CPU utilization, memory usage, queue depth). These correlate with problems but don’t directly measure user experience. A service can have high CPU and perfect user-facing performance; it can have normal CPU and terrible latency.
Use instead: User-facing signals from your load balancer or API gateway:
- Availability:
successful requests / total requests(define “successful” explicitly—often 2xx and 3xx, but business logic may define success more narrowly) - Latency: proportion of requests completing within a threshold (p99 or a specific ms target), not average latency
- Error rate: proportion of requests resulting in errors (5xx, timeouts, or application-level errors)
- Correctness: for data pipelines or batch jobs, the proportion of outputs that are correct
For each SLI, be explicit about what you’re measuring and what you’re excluding. Planned maintenance windows, known external dependencies, health check endpoints—document what goes in the denominator.
Setting Targets
SLO targets should be set based on user need, not technical capability.
The question isn’t “what can we achieve?” but “what do users need to not be frustrated?” These are different. Your service might be capable of 99.99% availability, but if users are equally satisfied at 99.5%, you’re over-engineering reliability and could be spending that engineering effort elsewhere.
The Google SRE book suggests a useful exercise: ask what reliability level, if violated, would cause users to stop trusting your service and seek alternatives. That’s your target. If your service is genuinely irreplaceable in users’ workflows, the target is higher. If users tolerate occasional downtime without changing behavior, the target can be lower.
Practical starting points for different service types:
- Critical revenue path (checkout, payment processing): 99.9–99.99%
- Core product features: 99.5–99.9%
- Internal tooling: 99–99.5%
- Background processing (non-latency-sensitive): 95–99%
Avoid round numbers without justification. “99.9%” has a specific meaning (8.7 hours/year downtime allowance). “99.99%” means 52 minutes/year. Know what you’re committing to.
Error Budgets
The error budget is what makes SLOs operational rather than decorative.
If your SLO is 99.9% over 30 days, your error budget is 0.1% of requests—the requests you’re allowed to fail. Over 30 days with 1 million requests/day (30 million total), that’s 30,000 allowed failures.
The error budget policy defines what happens based on budget status:
- Budget healthy (>50% remaining): Normal development velocity. Reliability work competes with feature work on equal footing.
- Budget at risk (25–50% remaining): Reliability work gets prioritization. No risky deployments.
- Budget nearly exhausted (<25% remaining): Feature development pauses. All engineering effort goes to reliability improvements.
- Budget exhausted (0% remaining): Freeze on changes. Incident retrospective. Root cause and fix before resuming.
The error budget policy transforms SLOs from a measurement into a decision framework. Teams that haven’t adopted an error budget policy don’t change behavior based on SLO data—they just watch the number.
Alerting on Burn Rate
Naive SLO alerting fires when the SLO is breached. By then, it’s too late.
Burn rate alerting (the approach described in the Google SRE workbook) alerts when you’re consuming your error budget faster than sustainable.
A burn rate of 1x means you’re consuming budget at exactly the rate that would exhaust it at the end of the window—on track, no alert. A burn rate of 2x means you’ll exhaust the budget halfway through the window. A burn rate of 10x means critical—budget exhausted in 10% of the window.
A two-tier alert structure:
- Page (urgent): Burn rate > 14x over the last 1 hour and > 5x over the last 6 hours. This combination catches fast-burning incidents without false positives from short spikes.
- Ticket (non-urgent): Burn rate > 3x over 6 hours and > 1x over 3 days. This catches slow degradation that won’t cause an immediate SLO breach but will if unaddressed.
Most teams starting with SLO alerting begin with burn rate >5x over 1 hour as a single page threshold, then tune from there based on alert fatigue and incident patterns.
Multi-Window, Multi-Burn-Rate Alerting
The Google SRE workbook recommends a four-alert structure using two windows and two burn rates for comprehensive coverage:
| Severity | Short window | Long window | Burn rate | Error budget consumed |
|---|---|---|---|---|
| Page | 1h | 5m | 14.4x | 2% |
| Page | 6h | 30m | 6x | 5% |
| Ticket | 3d | 6h | 3x | 10% |
| Ticket | 3d | 6h | 1x | 10% |
This catches both fast incidents (high burn rate, short window) and slow degradation (lower burn rate, longer window). Start simpler if this is your first implementation—the important thing is having any alerting, not having the perfect alerting.
Common Implementation Mistakes
Setting SLOs without an error budget policy: An SLO without consequences for budget exhaustion doesn’t drive decisions. Define the policy before the metric.
Too many SLOs: Five well-enforced SLOs are more valuable than thirty SLOs nobody pays attention to. Start with the two or three user journeys that matter most.
Not reviewing SLOs regularly: SLOs need a quarterly review—are the targets still appropriate? Are users more or less sensitive to the dimension you’re measuring? Has the service’s role changed?
Excluding “external” failures: Teams commonly exclude failures caused by dependencies from their SLO measurement. This is understandable but wrong—if users experience a failure, it counts, regardless of which system caused it. The SLO measures user experience, not engineering blame.
Ignoring the denominator: SLO calculations depend on the denominator being accurate. If you’re only counting requests that make it to your service (excluding those dropped at the load balancer), your measurement is optimistic.
Making SLOs Drive Decisions
The test of whether your SLO program is working: can you point to a decision that was made differently because of SLO data?
- Did a release get rolled back because it was burning error budget?
- Did a feature ship get delayed because a service was in budget deficit?
- Did reliability investment get prioritized over feature work based on budget status?
If the answer to all three is “no,” the SLOs are decorative. The error budget policy and the team culture around respecting it are what give SLOs their operational weight.
SLOs work best when they’re owned by the team responsible for the service, reviewed in incidents and retrospectives, and treated as a shared contract between that team and its users—not as a compliance exercise imposed from above.