Nebula — Cross-Cloud IoT Device Management
Case study: Unified IoT device management platform spanning AWS IoT Core, Azure IoT Hub, and Google Cloud IoT. Single dashboard for thousands of edge devices across cloud providers.
Project Overview
The client had built and acquired IoT infrastructure over several years across different cloud providers. AWS IoT Core managed their original device fleet, Azure IoT Hub handled a product line from an acquisition, and a third deployment ran on Google Cloud. Operators were switching between three separate vendor consoles to monitor devices, with no way to correlate events or track fleet-wide health in one place.
We designed and built Nebula, a unified device management layer that abstracts all three cloud IoT providers behind a common API and presents operators with a single dashboard. The platform handles device provisioning, real-time telemetry, alerting, and configuration management regardless of which underlying cloud a device reports to.
Technical Architecture
Nebula was designed so that adding a fourth cloud provider in the future requires implementing a new adapter, not rearchitecting the platform:
- Provider Abstraction Layer: Node.js service with per-provider adapters for AWS IoT Core, Azure IoT Hub, and GCP IoT — each translates native events and commands to a common internal schema
- Telemetry Normalizer: Ingestion pipeline that maps vendor-specific message formats to a unified device telemetry record, enriched with device metadata before storage
- Device Registry: PostgreSQL-backed source of truth for device identity, cloud affiliation, firmware version, and last-known state — decoupled from any single provider’s registry
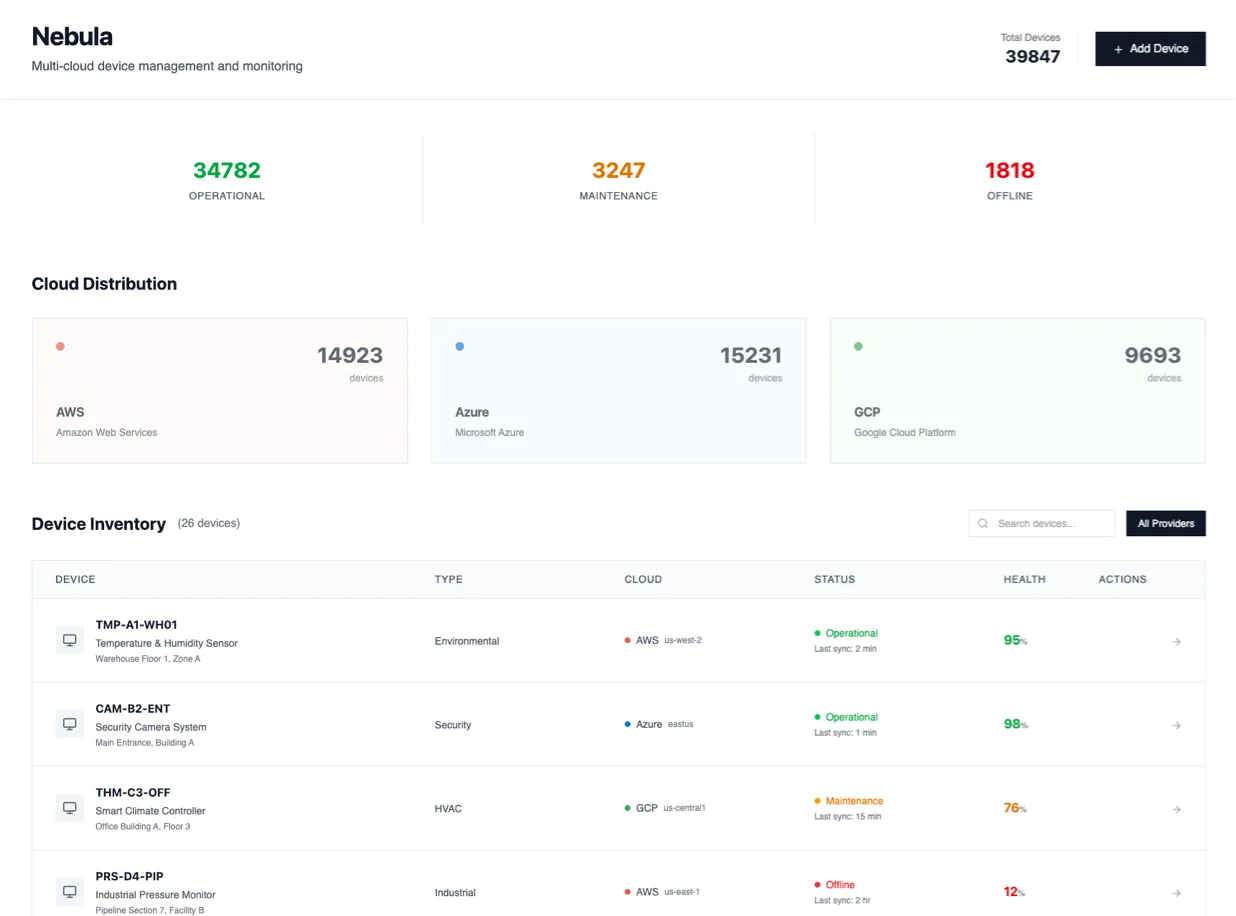
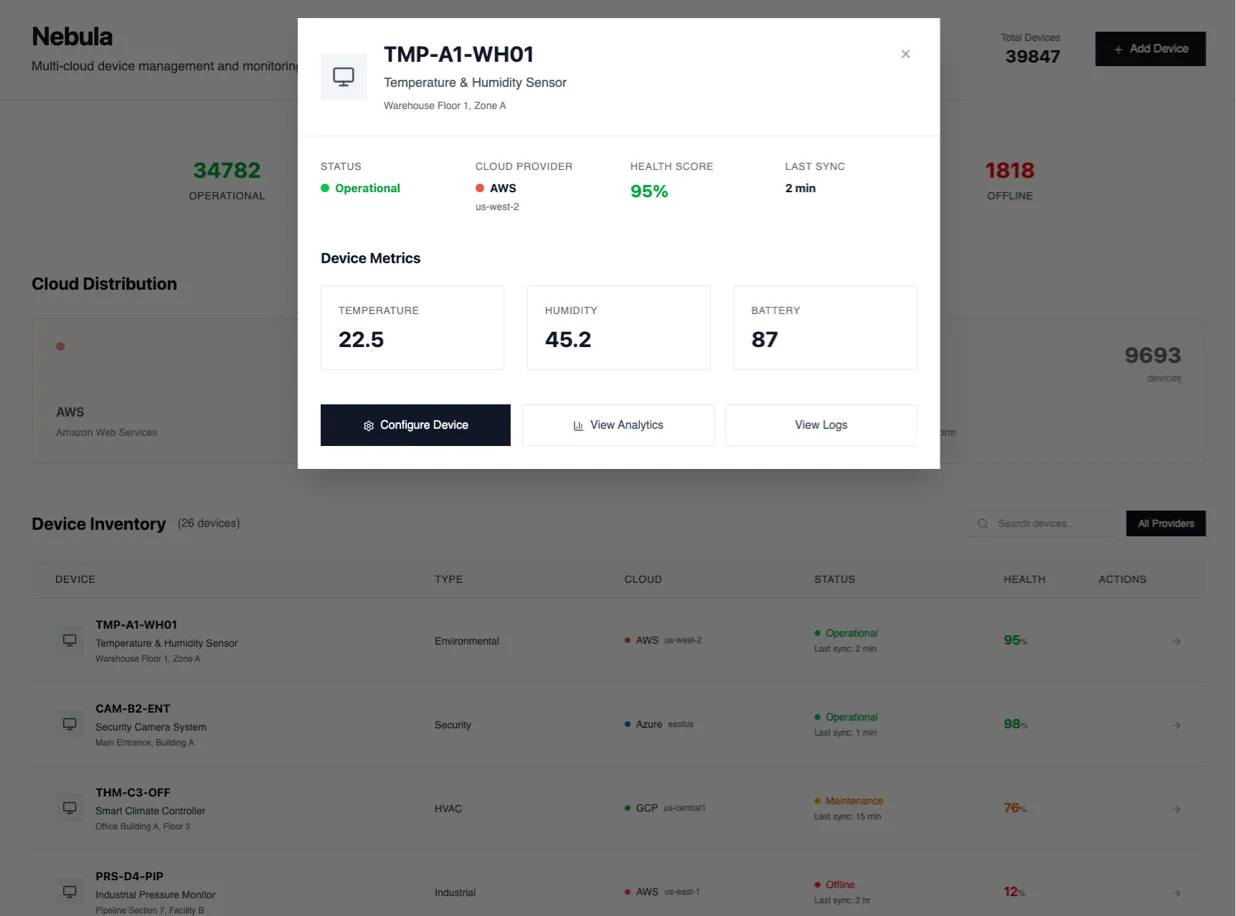
- Operator Dashboard: React frontend with real-time device maps, telemetry charts, alert feeds, and remote configuration — unified across all three cloud fleets
Operational Outcomes
Consolidating three cloud consoles into one platform eliminated the most friction-heavy parts of the operators’ daily workflow:
- Single pane of glass: All devices — regardless of cloud — visible in one dashboard with consistent status indicators, alert thresholds, and historical telemetry views
- Cross-fleet correlation: Operators can now identify fleet-wide patterns (firmware-version defects, regional anomalies) that were invisible when each cloud was managed in isolation
- Faster incident response: Unified alerting means on-call engineers receive one alert stream with full device context, instead of monitoring three separate notification channels
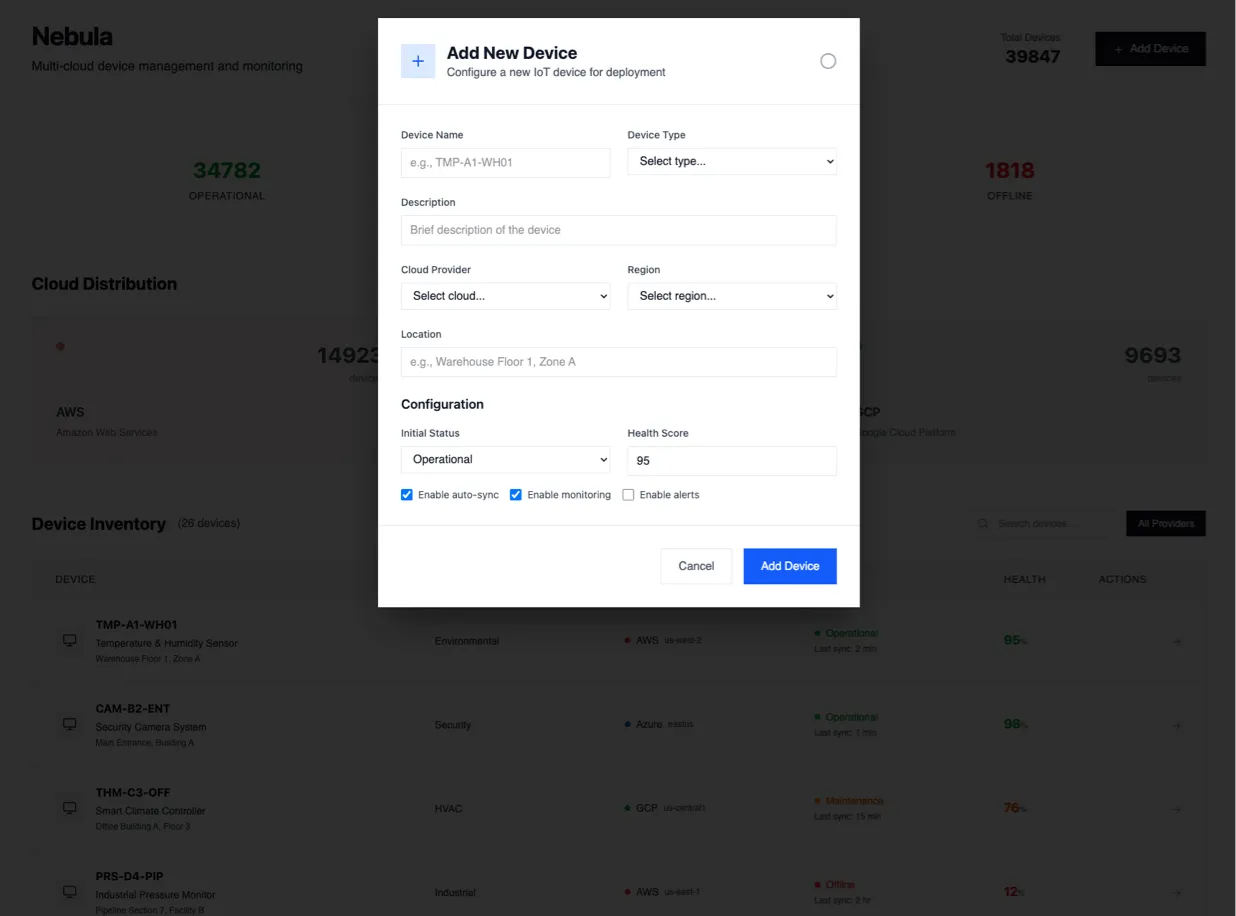
- Simplified provisioning: New devices are onboarded through a single interface that routes provisioning to the correct underlying cloud based on product line — no direct vendor console access required
Challenges
- Managing devices across three cloud providers from a single interface
- Normalizing telemetry data from heterogeneous device types
- Ensuring consistent security posture across cloud boundaries
Solutions
- Built a unified API layer abstracting AWS, Azure, and GCP IoT services
- Designed a common telemetry schema with per-provider adapters
- Implemented centralized identity and access management
Results & impact
Single dashboard managing devices across all three cloud providers
Normalized telemetry ingestion pipeline
Reduced operator context-switching overhead