Free Tool
CI/CD Pipeline Health Check
Enter your pipeline metrics and see how you stack up against DORA benchmarks. Get an honest performance tier and actionable recommendations.
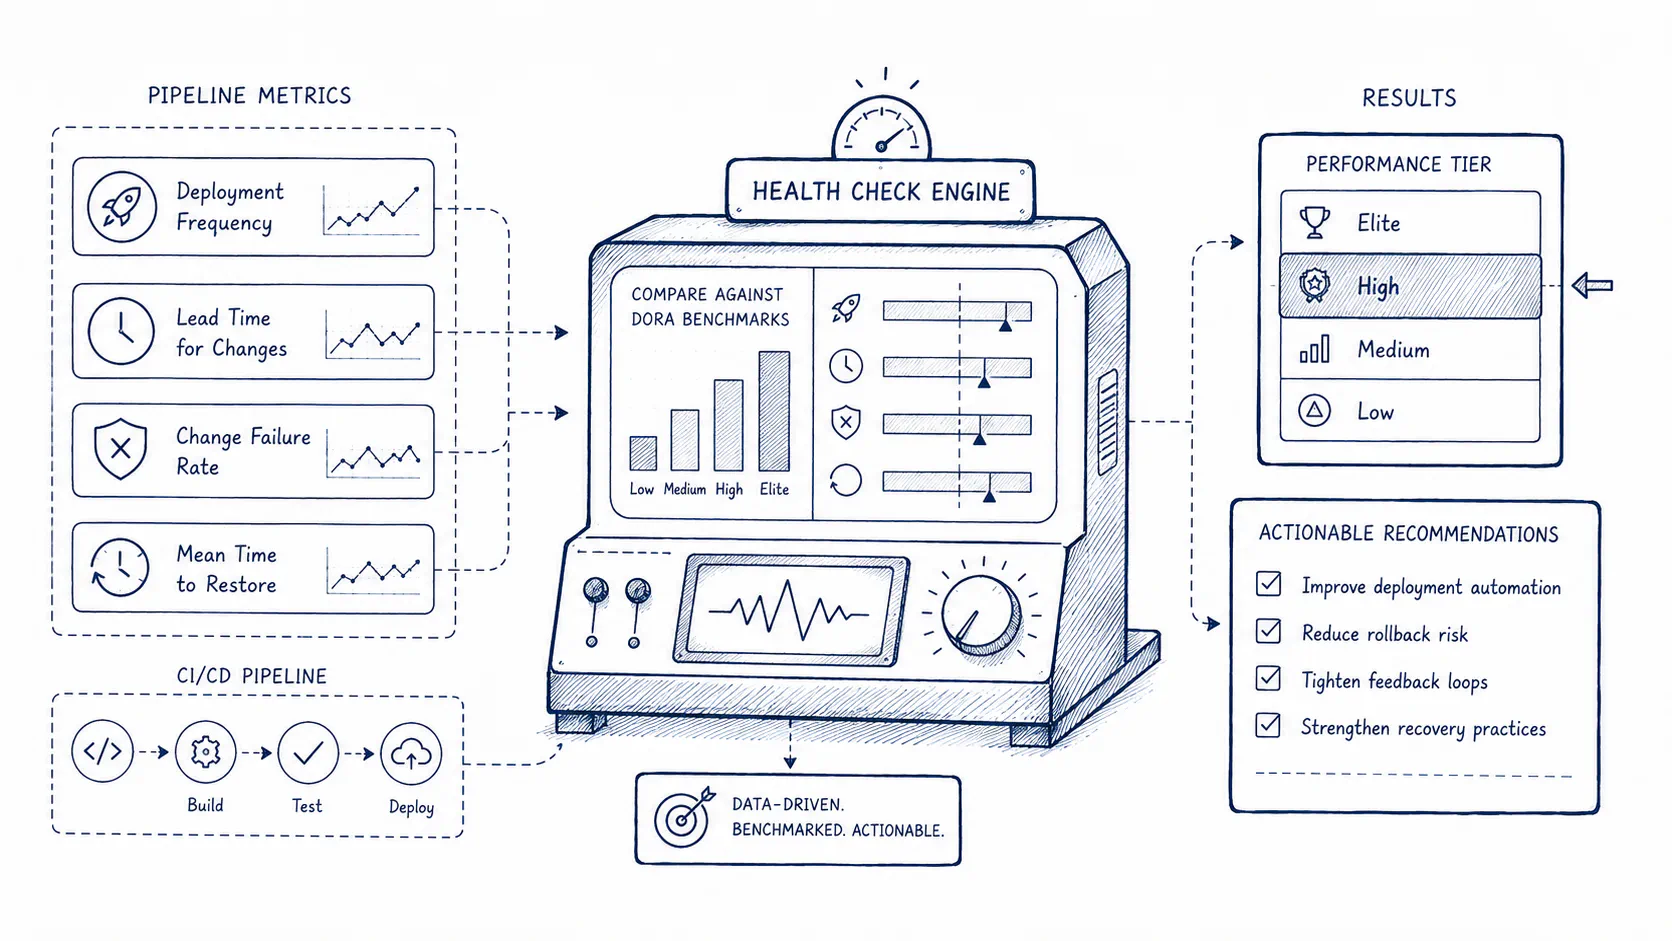
Deployment Frequency
How often does your team deploy to production?
Lead Time for Changes
Code commit → production. How long does it take?
Change Failure Rate
What % of deployments cause an incident or rollback?
Mean Time to Restore
When production breaks, how long to full recovery?
Overall Performance
Deploy Freq
Lead Time
Failure Rate
MTTR
Want a deeper diagnosis?
These benchmarks show where you stand. A systems assessment shows you exactly what to fix and in what order.
Schedule a Free Discovery CallDORA Benchmark Reference
| Metric | Low | Medium | High | Elite |
|---|---|---|---|---|
| Deploy Frequency | < 1/month | 1/month – 1/week | 1/week – 1/day | Multiple/day |
| Lead Time | > 1 month | 1 week – 1 month | 1 day – 1 week | < 1 hour |
| Change Failure Rate | > 20% | 10 – 20% | 5 – 10% | 0 – 5% |
| MTTR | > 1 week | 1 day – 1 week | 1 – 8 hours | < 1 hour |
Source: DORA State of DevOps Report. Tiers may vary slightly by year and industry.